Checking a migration: pbi-doctor and SchemaDrift
One tool reads the new Power BI report; the other asks whether the data survived the move.
A migration can look finished and still be wrong. The screens match; the numbers underneath do not.
Two checks at the end of the line
The pipeline has six stages: parse the workbook, extract the calculations, translate them, write the Power BI project, lint it, then reconcile the data. A first translator converts one calculation at a time. It does not yet read a workbook or write a project1.
These two tools cover the last two stages. pbi-doctor reads the new report. SchemaDrift compares the old data with the new. Both return an exit code, so a pipeline can stop on a failure.
pbi-doctor reads the report
pbi-doctor is a static analyzer for a Power BI project saved as .pbip in the PBIR format2. It runs 14 rules across report, page and visual scope.
It borrows Tableau Doctor's weights: high 10, medium 4, low 1, subtracted from 1002. The weights match, so both tools score the same way. Their rules differ, so compare a score only with earlier runs of the same tool. The thresholds also come from Tableau Doctor; none was measured on Power BI reports3.
The rules look for problems a reviewer would circle:
- Too many visuals or slicers on one page.
- Hidden pages that still sit in the page order.
- Overlapping visuals, or visuals placed off the canvas.
- Visual queries that pull too many fields at once.
- Custom visuals, which a Power BI admin must allow in the service4.
The rule that refuses to guess
PBIR report JSON changes between Desktop releases5. A linter that reads a renamed key as absent fails silently: it sees "no problem" and scores a perfect 100.
Microsoft now publishes versioned PBIR schemas and a validator; pbi-doctor does not use them yet5.
A rule that cannot read its anchor never passes. It reports one of two states instead, and the report counts both2.
| State | Meaning |
|---|---|
| Clean | The rule read its anchor and nothing tripped. |
| Finding | The rule read its anchor and tripped. It counts against the score. |
| Unreadable | A mandatory anchor is gone. The schema moved, and the rule is blind. |
| Not exercised | An optional anchor is absent. The feature is simply unused. |
A 100 with blind rules is not a pass. The report's coverage block says how many rules could actually see.
pbi-doctor status, plainly
pbi-doctor has not run on a real project yet. Its anchors come from Microsoft's documentation and one hand-port session2.
On a synthetic sample with 3 pages and 12 visuals, it scored 61. It raised 12 findings: 1 high, 6 medium and 5 low6. Its self-test suite holds 51 tests2. The next step is a real .pbip, then correcting every anchor that does not match.
SchemaDrift asks whether the data survived
SchemaDrift compares a source table with its migrated target7. It runs six checks.
| Check | Fires when |
|---|---|
| Schema | A column is dropped, added or reordered |
| Row count | The two tables differ in rows |
| Nulls | The share of empty values shifts |
| KS | A numeric distribution moves (Kolmogorov-Smirnov) |
| PSI | Values shift between buckets (Population Stability Index) |
| Crosswalk | A category value exists on one side only |
The demo compares 5,000 legacy rows with 4,998 migrated rows. Five defects were planted on purpose. The verdict is FAIL, with 8 findings, and every one of the six checks fires7.
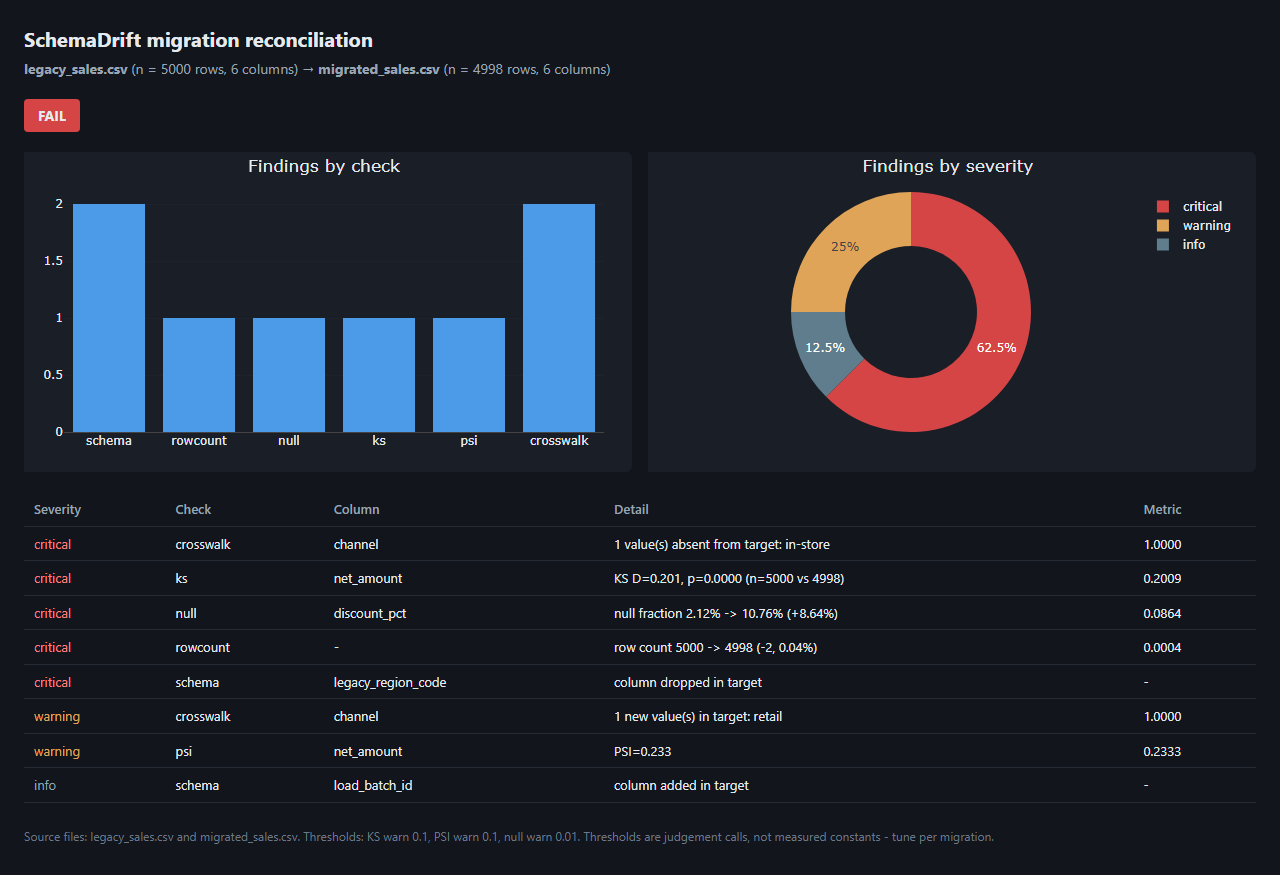
The data is generated by tableau/schemadrift/fixtures/make_fixtures.py; it is not from any real warehouse7.
The findings read like a migration post-mortem:
- The
in-storechannel vanished from the target, renamedretail. - Empty discounts rose from 2.12% to 10.76% of rows.
- Net amount shifted: KS D of 0.201 and PSI of 0.233.
- One column was dropped, and two rows were lost.
The renamed category is the one to fear. Every total can still add up. One slice of the business disappears from a filter, and nobody sees an error.
A test that caught the tester
The first KS version reported drift of 0.02 for a sample compared with itself8. One identity test caught it: a table compared with itself must return zero. The fix handles tied values.
The lesson travels well. Any drift check must prove it stays silent on identical data.
SchemaDrift status, plainly
SchemaDrift has 59 tests and 94.7% line coverage7. The demo pair is synthetic. It proves the checks fire, not how a real warehouse behaves8.
Only CSV input works today, and there are no warehouse adapters yet. Whole tables load into memory, which suits a sample, not a billion rows7. Thresholds are judgement calls, and each report prints the ones it used.
What this means for your BI team
- Define done before the move. Done means the data reconciles and the report passes its checks, not that the screens look alike.
- Ask for an exit code. A check that can fail a pipeline is worth more than a sign-off meeting.
- Treat "could not read" as missing coverage. Ask every tool how it reports what it cannot see.
- Demand a value crosswalk. Every dimension that feeds a filter needs one, because renamed categories fail silently.
Notes
creation-test/danieljin-bi/brief/content-inventory.md, section C: the six-stage pipeline plan.creation-test/danieljin-bi/shared/TRANSLATOR.md: the translator built on 2026-10-17 converts one calculation at a time and reads no.twbor PBIP file. ↩︎tableau/pbi-doctor/README.mdand thepbi_doctor.pydocstring: 14 rules, weights, the states a rule reports, prototype status, 51 tests. ↩︎../knowledge/modules/pbi-doctor.md: the thresholds are transplanted from Tableau Doctor, not measured on Power BI reports. ↩︎- Microsoft Learn, "Organizational visuals" (Fabric admin): the SDK visuals setting is disabled by default in the service. learn.microsoft.com/en-us/fabric/admin/organizational-visuals, accessed 2026-10-17. ↩︎
- Microsoft, json-schemas repository,
fabric/item/report: versioned PBIR report schemas with release notes and per-schema changelogs, github.com/microsoft/json-schemas, accessed 2026-10-17. The validator ships in@microsoft/powerbi-report-authoring-cli0.5.0, a public preview on npm, accessed 2026-10-17. ↩︎ tableau/pbi-doctor/reports/SalesDemo.json: 3 pages, 12 visuals, score 61, findings by severity 1 / 6 / 5, and all 14 rules evaluated, 11 of them with findings. No real project was available, so fixtures are synthetic (tableau/pbi-doctor/test_pbi_doctor.py). ↩︎tableau/schemadrift/README.md: six checks, the generated demo of 5,000 vs 4,998 rows with 8 findings, 59 tests, 94.7% coverage, known gaps. ↩︎../knowledge/modules/schemadrift-reconciliation.md: the KS tie bug, the identity test, and the synthetic-demo caveat. ↩︎
Sources
Weighing a move between Tableau and Power BI?
Email Daniel