Your filter fixed the view and changed the KPI
Six synthetic rows show one Tableau formula that should return 30%, 60%, 75% or 100% for the same selections, per Tableau's documented filter order.
Same year. Same region. Four different answers.
By Tableau's documented filter order, one percentage can read anywhere from 30% to 100% while every selection stays the same12. Only the filter scope moves. That is how a fix to the view quietly becomes a change to the KPI.
Start with the question
What share of 2026 sales came from East?
Write that sentence down before you touch a filter. It fixes the denominator: all regions, 2026 only.
Six rows you can check by hand
The example data is synthetic. It is six invented rows, not company data and not anyone's workbook3.
| Year | Region | Sales |
|---|---|---|
| 2025 | East | 100 |
| 2025 | West | 300 |
| 2025 | West | 100 |
| 2026 | East | 200 |
| 2026 | East | 100 |
| 2026 | West | 200 |
All-year sales total 1,000. Sales in 2026 total 500, and East holds 300 of them. The answer we want is 300 / 500, or 60%.
One formula, four scopes
The calculation divides sales by a FIXED total. The view holds a single mark.
SUM([Sales]) / ATTR({FIXED : SUM([Sales])})Year stays on 2026 and Region stays on East throughout. The only change is which filters are promoted to context.
Tableau's documentation sets the order. FIXED calculations are applied before dimension filters, unless those filters are promoted to context2.
| Context filters | Numerator | Denominator | Share | Answers our question? |
|---|---|---|---|---|
| Neither | 300 | 1,000 | 30% | No |
| Year only | 300 | 500 | 60% | Yes |
| Region only | 300 | 400 | 75% | No |
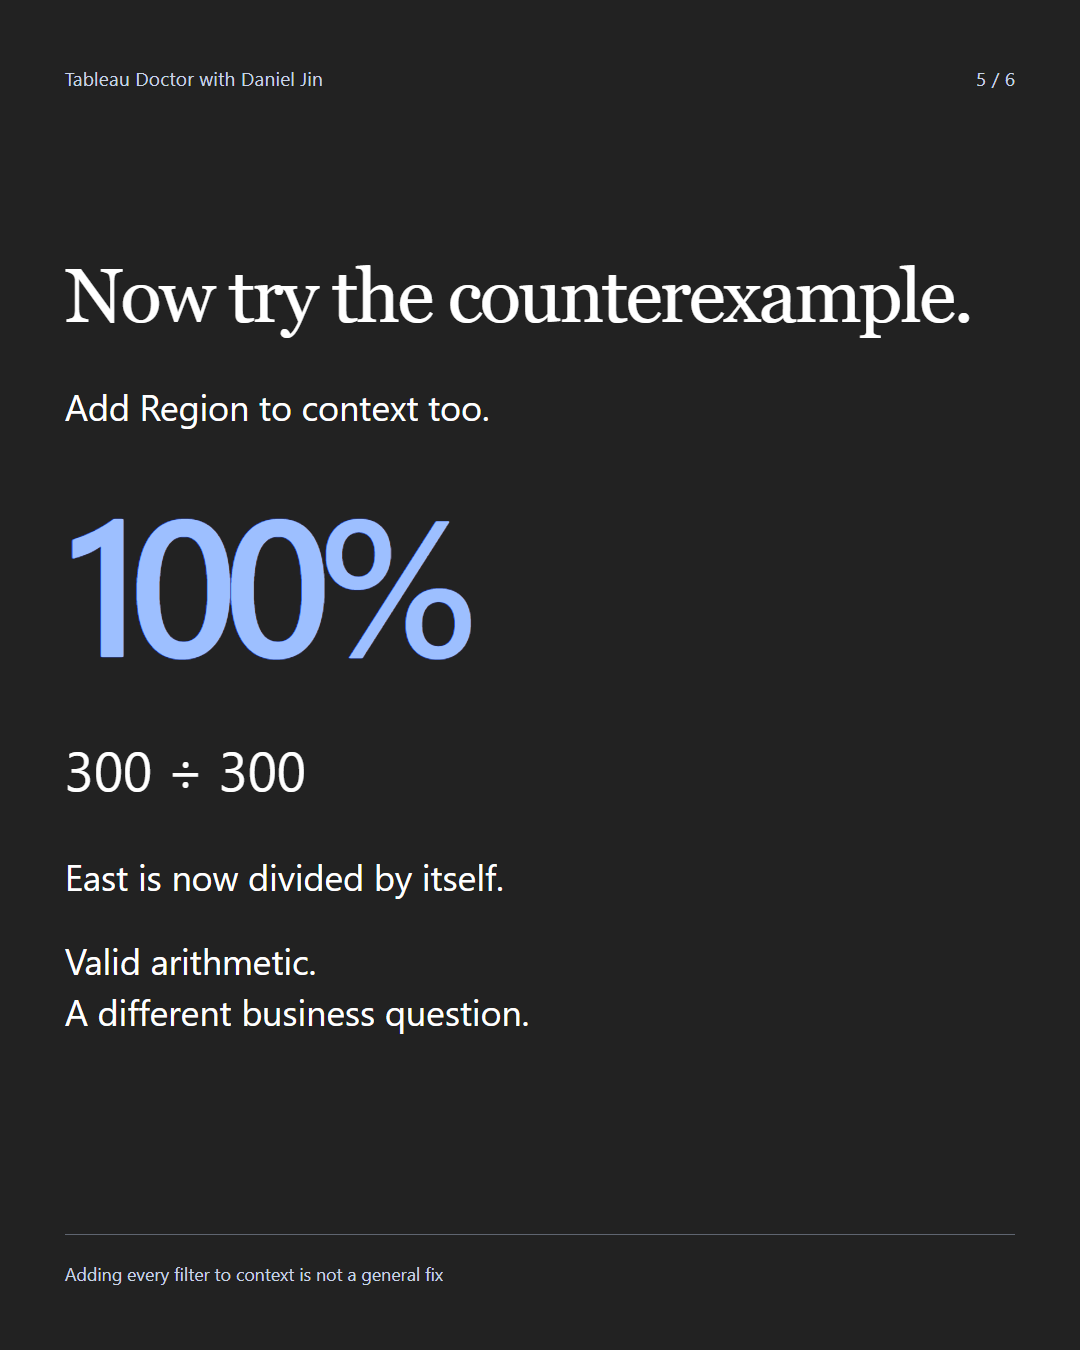
| Year and Region | 300 | 300 | 100% | No |
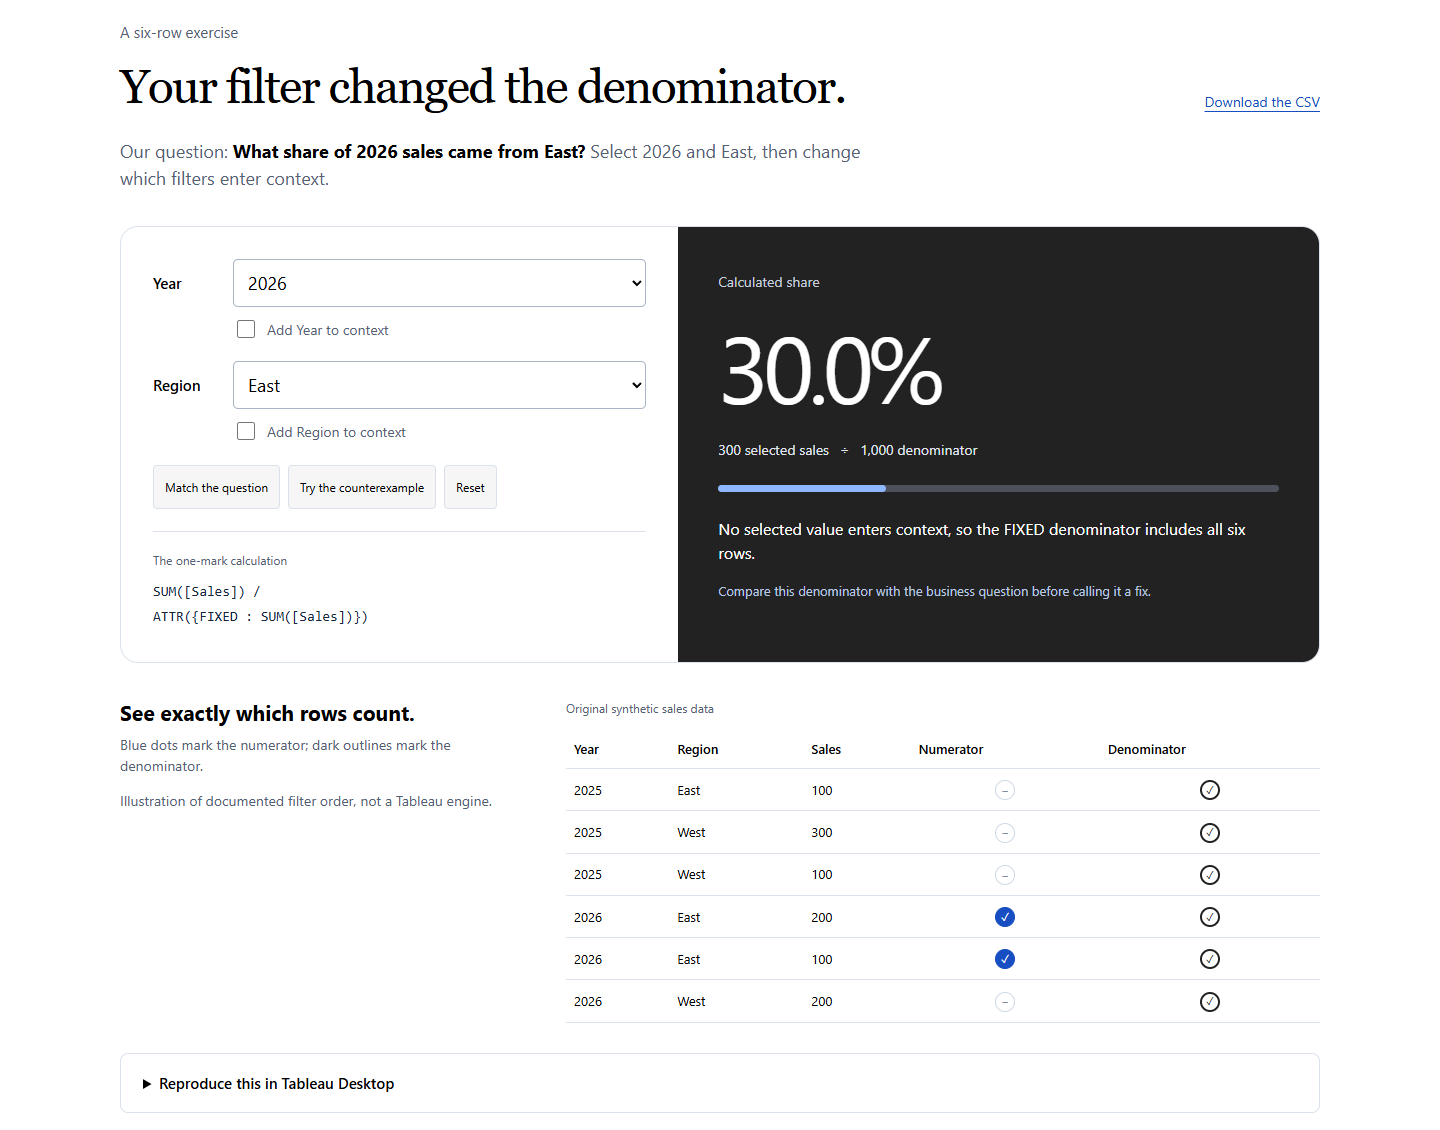
Read the last row of the table twice. Putting every filter in context looks like the safe fix. It divides East by itself.
Two suspects, one change at a time
When a share looks wrong, start with two suspects1. The numerator or the data grain may be wrong. Or the denominator may be scoped differently from the question.
Check the six rows and the numerator of 300 first. Then change one scope setting at a time. Keep the rows, the formula and the selections fixed.
No state in the table is the bug. Each one answers a different question. The 100% state is correct arithmetic for East's share of East.
What was built, and what is pending
- A browser lab. You flip each filter in and out of context and watch the rows that count. The studio's verification run passed 73 checks, among them all 36 control combinations of the lab4.
- A negative control. One check confirms that putting everything in context fails the 60% target4.
- Teaching assets. Six 1080 × 1350 carousel slides and a silent clip of about thirty seconds5.
- Not a Tableau engine. The lab is an illustration in JavaScript of the documented filter order1.
- Runtime confirmation pending. The expected results have not yet been reproduced in Tableau Desktop with a recorded version4.
Until that run happens, the table above is a prediction from the documentation. It is a well-grounded prediction, and it is labelled as one.
What this means for your BI team
- Write every ratio KPI as a sentence. Name the numerator and the denominator in plain words, and store that definition with the metric.
- Ask for the counterexample. A fix that passes one case and fails the obvious neighbour is not a fix.
- Expect this in a migration. In Power BI the same intent lives in the measure. A DAX measure keeps or removes filters on purpose, for example with REMOVEFILTERS6.
- Test parity against the definition. Compare the new number to the written question, not to a screenshot of the old dashboard.
Notes
tableau/doctor/studio/episode-001.md: business question, recipe, four expected states, and the two-hypothesis method for this case. ↩︎- Tableau Help, "Filters and Level of Detail Expressions", help.tableau.com, accessed 2026-10-17; see also Tableau's order-of-operations page. ↩︎
tableau/doctor/studio/episode-001.mdcalls the data "an original synthetic dataset"; the six rows are intableau/doctor/studio/site/filter-lab.csv. ↩︎tableau/doctor/studio/artifacts/verification.json: status passed, 73 checks,tableau_runtime_verifiedfalse. ↩︎../knowledge/modules/tableau-doctor.md, creator studio evidence: six 1080-by-1350 carousel PNGs and an approximately thirty-second 1080-by-1920 silent MP4. ↩︎- Microsoft Learn, "REMOVEFILTERS function (DAX)": clears filters from the specified tables or columns. learn.microsoft.com/en-us/dax/removefilters-function-dax, accessed 2026-10-17. ↩︎
Sources
Weighing a move between Tableau and Power BI?
Email Daniel