Nine executive Power BI themes
Nine theme files, valid against Microsoft's theme schema and checked for contrast, colour blindness and the schema's blind spots.
A theme will not answer the board's question. It can stop colour from hiding the answer.
The brief
The brief was blunt: which Power BI themes would a CEO take seriously? The working answer was themes that make status obvious in seconds, then stay out of the way1. Nine of them ship as JSON files.
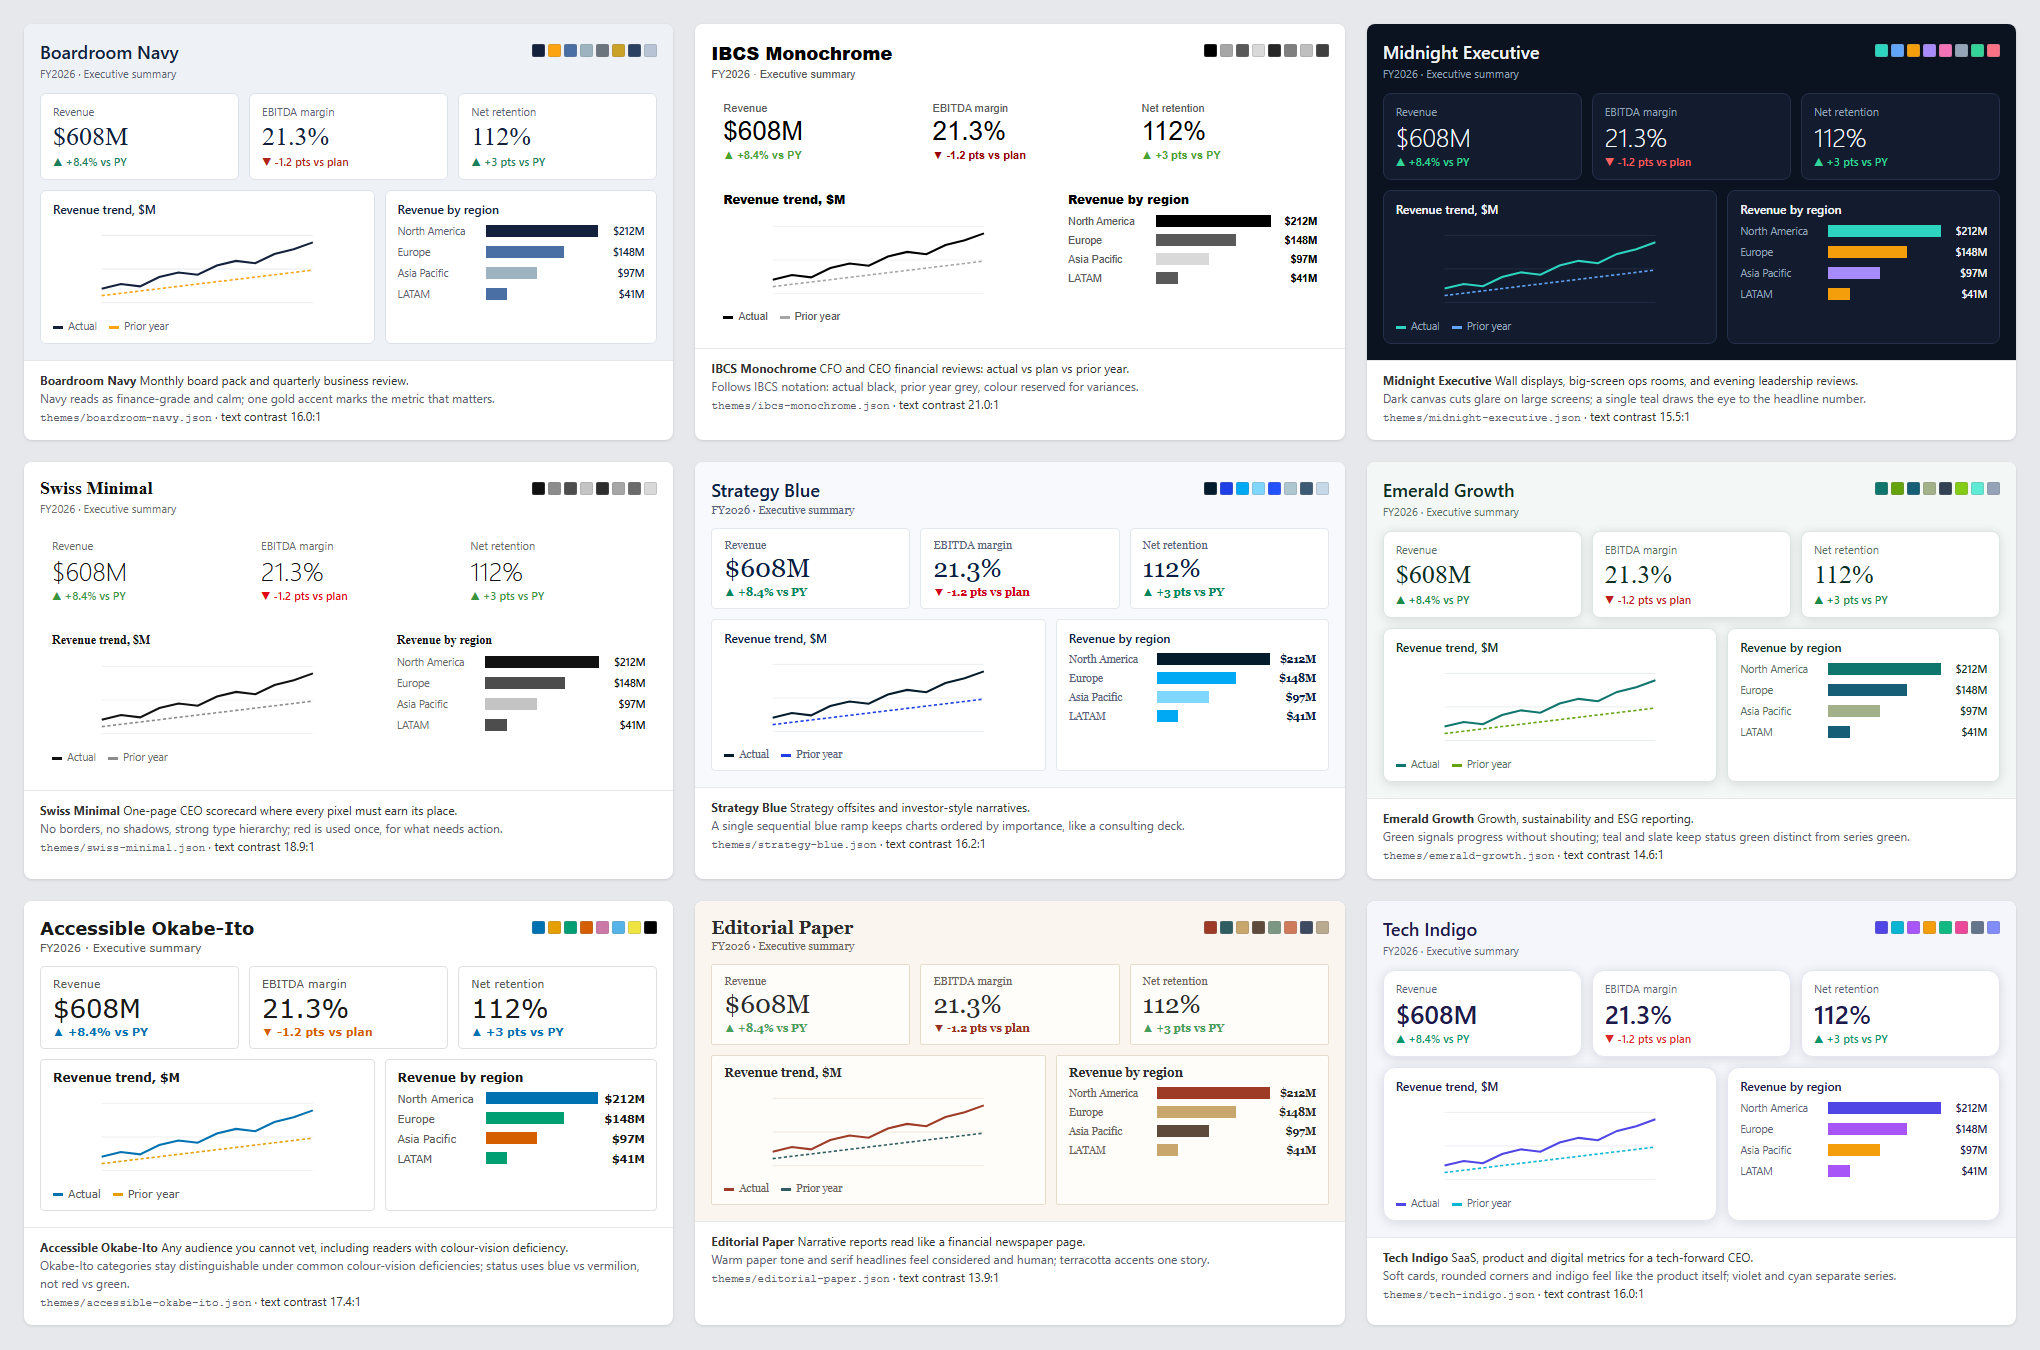
The nine
| Theme | Built for |
|---|---|
| Boardroom Navy | Board pack and quarterly business review |
| IBCS Monochrome | CFO review: actual vs plan vs prior year |
| Midnight Executive | Wall displays and large screens |
| Swiss Minimal | A one-page scorecard |
| Strategy Blue | Strategy offsites and investor narratives |
| Emerald Growth | Growth and ESG reporting |
| Accessible Okabe-Ito | Audiences you cannot vet |
| Editorial Paper | Narrative, newspaper-style reports |
| Tech Indigo | SaaS and product metrics |
The rules underneath
- Colour means status, not decoration. Series colours stay calm, and good and bad carry the meaning2.
- Finance notation where finance expects it. IBCS Monochrome shows actual in black and prior year in grey, with colour reserved for variances2.
- Status survives red-green colour blindness. Every good and bad pair is checked under simulated deuteranopia and protanopia2.
- Built-in fonts only. A font missing on a viewer's machine falls back to something else2.
The checks
| Gate | Result |
|---|---|
| Microsoft theme schema 2.157, plus a strict pass on global styles | 9 of 9 valid |
| Negative probes, one planted defect each | 14 of 14 rejected |
| Body text contrast, worst theme | 13.9:1 |
| Muted text contrast, worst theme | 5.3:1 |
| Good vs bad under simulated deuteranopia and protanopia, worst theme | ΔE 21.9 |
| Waterfall total colour, four themes | 2.25-2.94:1, under the 3:1 non-text minimum |
The schema gates were re-run on the nine theme files on 2026-10-173. The contrast and colour-blindness gates were re-run on the nine themes the same day4. For scale, the WCAG 2.1 minimum for normal text is 4.5:15. The worst body text here sits about three times above it4.
Three traps the checks caught
Microsoft's schema skips the global section
Most theme styling lives in one global card section. Microsoft's schema checks that section with wildcards2.
In testing, a raw colour string passed. So did a misspelled bakground, and an unknown property. The same raw string inside a typed section was rejected. A separate validator now checks every global card by name.
One probe, one defect
The first negative test planted two defects at once. It was rejected, which looked like success2.
Only one defect had been caught; the other hid behind it. Splitting the probes to one defect each exposed the gap.
Hue alone does not separate good from bad
Five first drafts failed the colour-blindness check, at ΔE under 202. Their red and green differed in hue but sat at similar lightness. The fix opened a lightness gap between good and bad. The gallery also pairs status colour with ▲ and ▼.
A fourth trap was caught by eye, not by a check. Two themes put red second in the data colours, so any two-series chart painted prior year red2. A guard now fails any theme that promises "red only for action" and breaks the promise.
Presets and a brand generator
Every theme carries three named presets: KPI Card, Variance Bar and IBCS Column Chart1.
A small command-line tool turns brand hex colours and one font into a validated theme. It refuses a good and bad pair that collapses under colour blindness. It never nudges the brand's colours apart on its own2.
What is not proven
The themes were not imported into Power BI Desktop. It was not installed on the build machine1.
The presets and the Style dropdown are unverified in Desktop. A theme also cannot hold conditional formatting2. Status colour per value still needs a DAX measure that returns good or bad.
On four themes, the waterfall total sits under the 3:1 non-text minimum45. It uses the theme's neutral colour, as Power BI does by default2.
What this means for your BI team
- Treat a theme as policy. One file sets fonts, status colours and contrast for every report that imports it.
- Decide what red means once. Then check that no chart spends it on decoration.
- Test colour blindness by lightness. Two colours that differ only in hue can look identical to some of your readers.
- Port the rules, not the hex codes. In a Tableau to Power BI move, write the colour logic down and rebuild it on purpose.
Notes
tableau/powerbi-themes/executive-themes.md: the theme specs, style presets, original check results and caveats, including that gallery figures are synthetic and identical on every tile. ↩︎../knowledge/practices/executive-dashboard-themes.md: design rules, IBCS notation, the theme JSON contract, schema traps, the brand CLI and verification. ↩︎creation-test/danieljin-bi/content/checks/themes_nine_schema.txt: the output oftableau/powerbi-themes/validate_themes.json the nine files, run 2026-10-17 with Ajv 8.20.0. It reports 9 of 9 valid, 14 of 14 probes rejected and exit 0. ↩︎creation-test/danieljin-bi/content/checks/themes_nine.json: the 2026-10-17 contrast and colour-blindness re-run on the nine published themes, fromtools/lab/themes_nine.py, including the four waterfall totals at 2.25-2.94:1. ↩︎- W3C, WCAG 2.1, Success Criteria 1.4.3 Contrast (Minimum) and 1.4.11 Non-text Contrast, w3.org/TR/WCAG21, accessed 2026-10-17. ↩︎
Sources
Weighing a move between Tableau and Power BI?
Email Daniel