Under the Tableau canvas
Filter order, set actions, schema drift and a twelve-node cluster: the mechanics a Tableau-to-Power BI migration has to carry across.
Anyone can drag a field onto a canvas. Few can say which query it sends, and when.
That gap decides whether a Tableau-to-Power BI migration keeps its numbers.
1. Filter order decides the number
Tableau applies filters in a fixed order: extract, data source, context, dimension, measure, then table calculation1. Level of detail (LOD) expressions enter that order at different points.
| Expression | Computed | Does a dimension filter change it? | Usual home in Power BI |
|---|---|---|---|
| FIXED | Before dimension filters | No, unless the filter is in context | SQL GROUP BY or a window, upstream; in the model, CALCULATE with REMOVEFILTERS plus VALUES of the FIXED dimensions, not ALLEXCEPT |
| INCLUDE | After dimension filters | Yes | An iterator over the extra dimension, such as AVERAGEX(VALUES(dim), CALCULATE(...)) |
| EXCLUDE | After dimension filters | Yes | CALCULATE with ALLSELECTED on the excluded column; REMOVEFILTERS would also drop that column's slicer |
| Table calculation | On the result set | Yes | SQL window or DAX |
The last column is my working mapping, not a vendor rule2.
Here is why it matters. A FIXED share-of-total keeps its denominator when a quick filter removes rows1. That is right for "share of the company". It is wrong for "share of what I am looking at".
Tableau offers two fixes. Promote the filter to context, so it runs before FIXED. Or rewrite the calc as INCLUDE or EXCLUDE, which respect dimension filters3.
Power BI works the other way round. A measure sees every slicer and filter unless it says otherwise, with ALL, ALLEXCEPT or REMOVEFILTERS4. So each FIXED calc needs one written decision: which filters should it ignore?
2. Set actions turn a dashboard into a small app
A set action changes a set's members when the reader selects marks5. One calculated field then decides what each row shows. The classic use is an asymmetric drill: open one department, keep the rest folded.
IF [Selected Department Set] THEN [Work Group]
ELSE "+ " + [Department]
END
When the selection clears, the action can keep the set, fill it or empty it5. The Kansas City 311 explorer drills the same path in Plotly, department to work group to request type. It swaps the view on each click rather than opening one row in place6.
Power BI has no set actions. A matrix visual gives each row its own expand control, which covers the common drill7. Field parameters let readers swap the field on an axis8. Budget these as redesigns, not translations.
3. Schema drift: the cutover nobody reconciled
Kansas City moved its 311 system from PeopleSoft to MyKCMO in March 2021. On 2026-09-24 the public record held 2,395,529 requests: 1,563,215 in the old system and 832,314 in the new9.
The systems overlapped for 253 days, from 2021-02-18 to 2021-10-28, with no shared key9. Monthly totals look like traffic moving across, not a parallel run. That is an inference, because no key exists to prove it.
| Measure | PeopleSoft | MyKCMO |
|---|---|---|
| Source columns | 30 | 18, down 40.0% |
| Request types in use, mean per year | 526.5 (2017–20) | 289.25 (2022–25), down 45.1% |
| Effective types, entropy-weighted | Baseline | Down 20.9% |
| SLA breach flag | 30.9% of requests ran over estimate | Dropped |
| Neighborhood | Text field | Computed region on 97.3% of requests |
A trend line across a cutover is two trend lines. Draw the seam on the chart.
Three habits keep that honest:
- Reconcile totals at the source. Aggregate on the server and check every sum against a count.
- Compare shares, not keys. When no key crosses the cutover, compare each category's share of volume before and after.
- Publish the crosswalk. Map every old category to its new home, and show what each merge does to the trend.
The first habit has a cautionary tale. Re-run on 2026-10-17, an unpaged pull of 2019 returned 1,000 of 166,021 requests, 0.6%, with no warning10. Socrata's docs say a query returns 1,000 rows unless you set a limit11. The original brief recorded 3,000, because it counted text lines, not records.
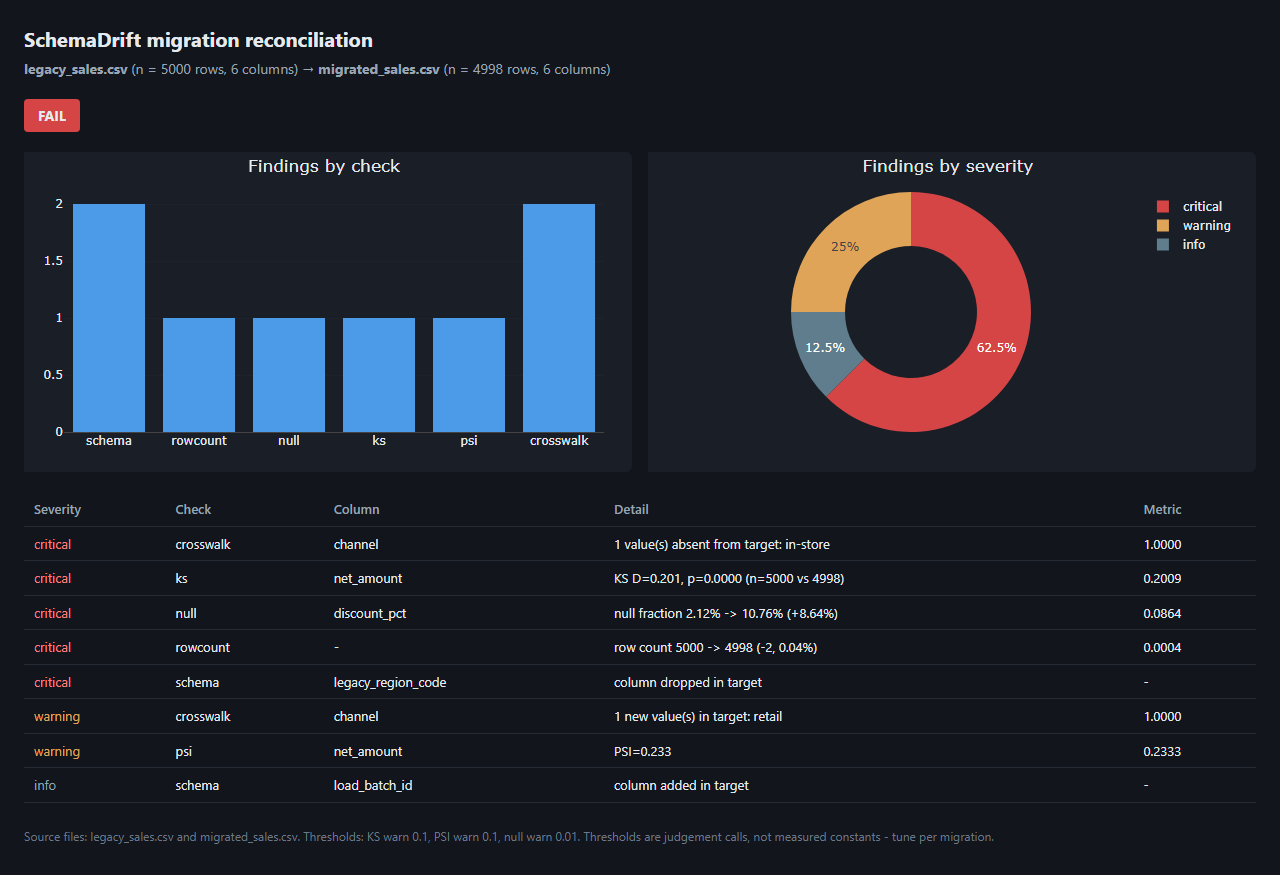
These checks fit in a tool. SchemaDrift compares a source and a target on six checks: schema, row count, nulls, a Kolmogorov-Smirnov test, a stability index and value lists12. On a demo of 5,000 rows against 4,998, with five planted defects, it fails with eight findings.
4. Twelve nodes, two kinds of work
I ran a 12-node Tableau Server cluster at American Century Investments and moved it to AWS EC2 Linux13. The lesson that scales: keep interactive viewing and background work apart.
Backgrounders run extract refreshes, subscriptions and flows. Tableau calls them resource intensive and allows at most one Backgrounder per two cores on a node14. Node roles can dedicate machines to extract refreshes. Tableau advises more than one node per dedicated role, and the feature needs Advanced Management15.
Here is an illustrative twelve-node layout. It is not the American Century cluster's configuration, and not a benchmark:
| Role | Nodes | Runs |
|---|---|---|
| Gateway and repository | 2 | Gateway and repository, active and passive |
| Interactive | 6 | VizQL Server, cache and data engine, with no extract refreshes |
| Background | 4 | Backgrounders and data engine, for refreshes, subscriptions and flows |
Coordination Service runs as a quorum-based ensemble of three or five nodes, spread across the cluster16.
Power BI on Fabric capacity has no nodes to place. It sorts work into interactive and background instead. Background operations are smoothed over 24 hours, interactive ones over at least five minutes17. Under overload, Fabric first delays new interactive work, then rejects it, while background work still runs17.
The design question survives the move. What must stay fast at the morning peak, and what can wait?
What this means for your BI team
- Inventory every calculated field by type before anyone quotes a migration: row-level, FIXED, INCLUDE, EXCLUDE and table calculation.
- For each KPI, write down which filters it must ignore: that one line becomes the DAX.
- List set actions and parameter actions on their own: they are rebuilds, so price them as rebuilds.
- Reconcile with totals and distributions, not row samples, and mark the cutover on every trend.
- Keep refreshes away from viewers, in either platform.
Notes
- Tableau Help, Tableau's Order of Operations, accessed 2026-10-17. ↩︎
- Author's working mapping, also applied by the site's calculation translator,
creation-test/danieljin-bi/shared/translator.js(2026-10-17). It is not yet tested on client workbooks. DAX behaviour per Microsoft Learn, ALLEXCEPT, ALLSELECTED and REMOVEFILTERS, accessed 2026-10-17. OnALLEXCEPTversusREMOVEFILTERSplusVALUES: Marco Russo and Alberto Ferrari, SQLBI, Using ALLEXCEPT versus ALL and VALUES, updated 2021-08-27, accessed 2026-10-17. ↩︎ - Tableau Help, Overview: Level of Detail Expressions, accessed 2026-10-17. ↩︎
- Microsoft Learn, DAX overview, sections "Query context" and "Filter context", accessed 2026-10-17. ↩︎
- Tableau Help, Set Actions, accessed 2026-10-17; the page includes an asymmetric drill-down example. ↩︎
- The old site's 311 page,
creation-test/danieljin-site/claude-opus-5.5_max/site/viz-technical-311.html: click a bar to drill down from "Level 1 of 3", then drill up. ↩︎ - Microsoft Learn, Create a matrix visual in Power BI, accessed 2026-10-17. ↩︎
- Microsoft Learn, Use field parameters in Power BI reports, accessed 2026-10-17. ↩︎
tableau/real-data-audit.md, claims 13, 15, 16 and 20 to 22, hypothesis H3, and the before-and-after rows for the 311 pages (overlap: 253 days); Socrata data queried 2026-09-24. ↩︎- Re-run of the unpaginated 2019 pull, accessed 2026-10-17. It returned 1,000 records on 3,001 text lines; the JSON form also returned 1,000. The original planning brief,
creation-test/danieljin-site/claude-opus-5.5_max/site/three-viz-brief.html, had recorded 3,000. The 2019 count of 166,021 matches the audit. Raw responses and sha256 hashes:creation-test/danieljin-bi/content/checks/kc311_recheck_2026-10-17/manifest.json. ↩︎ - Socrata Developer Portal, The LIMIT parameter, accessed 2026-10-17. ↩︎
tableau/schemadrift/README.md, which documents the six checks and the demo report. The demo data is synthetic. ↩︎- Résumé record,
tableau/build_resumes.js. ↩︎ - Tableau Help, Tableau Server Backgrounder Process, accessed 2026-10-17. ↩︎
- Tableau Help, Workload Management through Node Roles, accessed 2026-10-17. ↩︎
- Tableau Help, Deploy a Coordination Service Ensemble, accessed 2026-10-17. ↩︎
- Microsoft Learn, Understand capacity throttling and smoothing, accessed 2026-10-17. ↩︎
Sources
Weighing a move between Tableau and Power BI?
Email Daniel