How I run a migration without moving the numbers
Seven phases and one rule: nothing switches off until the numbers match, or until each difference has a name and an owner.
Moving the dashboards is the easy part. Keeping the numbers still is the job.
The bar
Microsoft's own guide sets it in two lines. The new report must match the legacy one. If it differs, the team must be able to explain why1. Here is how I clear that bar, in either direction, in seven phases.
The method comes from platform moves I have worked inside, such as a 12-node Tableau Server cluster moved to AWS, and from tools I built2. I claim no count of client migrations. Every figure below is public, or comes from my own tools.
1. Inventory, then scan
List every workbook or report, data source, calculation, user group and security rule. Then ask who opens each one.
In one Microsoft customer case, about half of thousands of reports had been opened in the past year. A value review halved that list again3. The cheapest report to migrate is the one you retire.
Then scan what survives. Tableau Doctor, my workbook linter, reads the XML against 25 rules4. Several also mark migration risk: nested LODs, COUNTD, calculation chains over three deep, NOW(), and sheets that draw on two or more data sources. For the reverse trip, pbi-doctor reads a Power BI project against 14 rules. It is a prototype, not yet run on a real project5.
2. Give every calculation a home
Microsoft's guide says measures, KPIs and business rules shape where logic lives: in the semantic model or in data integration6. So every calculation gets a home before anything is translated.
| Calculation | Usually lands in | Why |
|---|---|---|
| Row-level calcs and FIXED LODs | SQL or Power Query, upstream | Computed once, tested against the source |
| INCLUDE and EXCLUDE LODs | DAX CALCULATE patterns | They must respond to slicers |
| Ratios and simple aggregates | DAX measures | They must re-aggregate at every level |
| Table calculations | Visual calculations, window functions or SQL windows | Depends on whether results must be filtered or exported |
| Calculations built on calculations | One folded expression, upstream | Fewer layers, fewer places to drift |
One caution keeps this honest. A FIXED computed upstream ignores every slicer. It matches Tableau only when the sheet had no context filters7. The trip to Tableau asks the same question in reverse.
3. Translate, with a written log
Every calculation gets one log line: source, target, the trap it touches, the decision and who made it. My translation table lists the traps, each traced to a source. The translator on the home page drafts each line and grades it8.
The target is written as code: a PBIP project for Power BI, or a workbook for Tableau. One PBIP project I generated by script passed Microsoft's report validator and model parser9. Its first open in Power BI Desktop still failed, on a circular dependency between a month-name column and its sort column. The fix is in; the file has not been reopened.
That gap is the lesson. A validator checks the file. Only the engine checks the meaning.
4. Prove parity before anyone sees a chart
Sign the tolerance before the build. Then test the data, then the numbers on each page.
The data checks follow SchemaDrift, my reconciliation tool: schema, row count, nulls, two distribution tests and value lists10. Its demo compares 5,000 rows with 4,998, with five defects planted. Every one of the six checks fires.
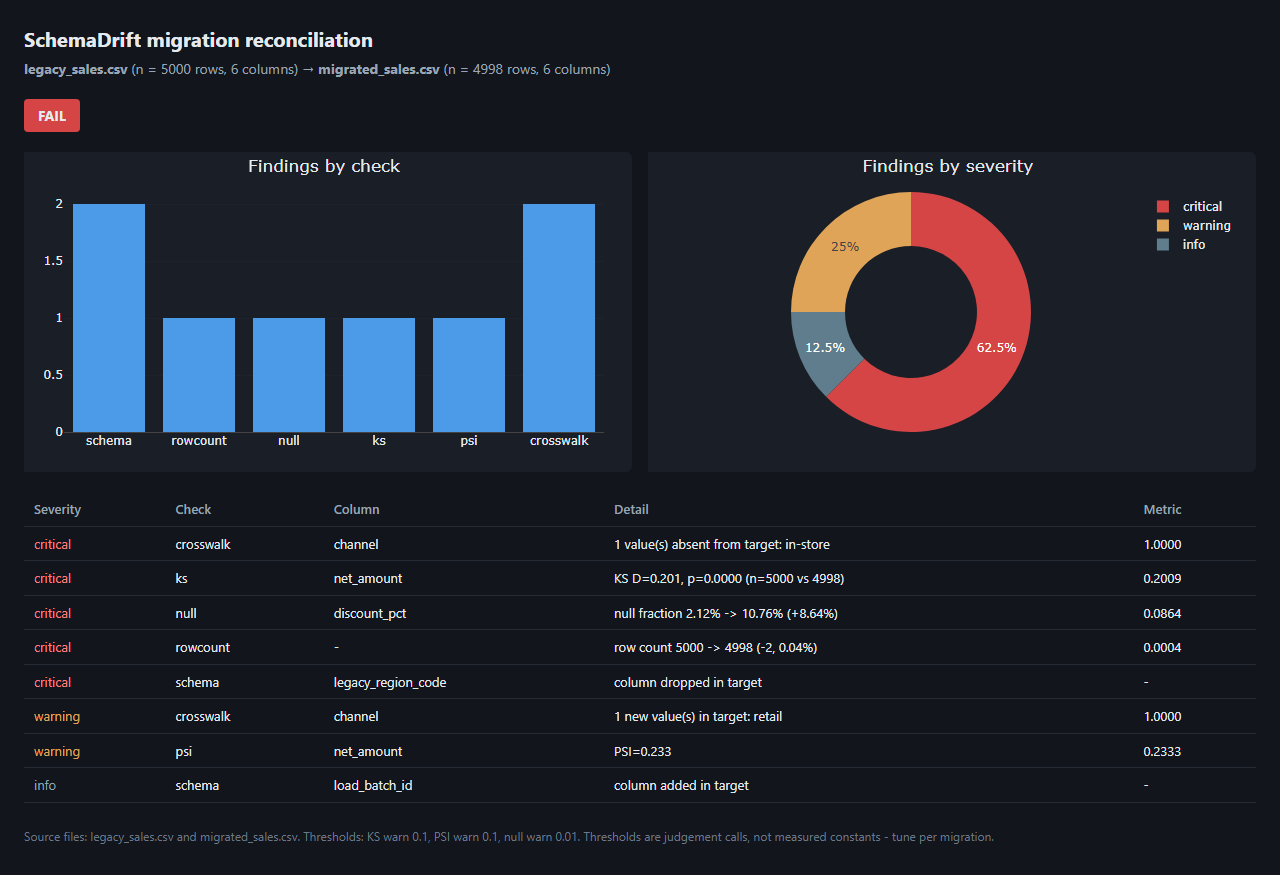
The quiet finding is the dangerous one. A sales channel called in-store arrived as retail. A total can still reconcile while one slice of the business drops out of every filter.
Silent loss is not hypothetical. An unpaginated pull of Kansas City's 2019 311 data returned 1,000 rows, 0.6% of that year's 166,021 requests, with no warning11.
Page-level numbers come next. Totals can match while the detail drifts, so each page is tested unfiltered, then under its common slicer combinations12. Power BI leaves visual calculation results out of data exports, so export-based checks miss them13. Speed counts too: Microsoft says most reports should present visuals in under 10 seconds1.
When old and new disagree, the difference gets a name. Microsoft says it is "more common than you might think" to find an error in the legacy report1. Log it as a finding. Never tune the new number to match.
5. Pilot three dashboards
Pick one high-value, one complex and one high-traffic dashboard. Test row-level security as named personas. Power BI RLS binds only the Viewer role, so a tester with edit rights sees every row14.
The pilot also calibrates the plan. In Microsoft's customer case, a report estimated at 50 days was redesigned in about 50 hours3. Estimates are most valuable in aggregate, so the pilot sets the pace for the waves.
6. Move in waves
Group each wave by data source and owner, and reuse shared semantic models. One Microsoft customer gave each report its own model, and duplicated data and business logic3.
Release to pilot users first, then widen access15. Each wave runs beside the legacy report for an agreed window, commonly 30 to 90 days15. Track report visits, active reports and distinct users each month; new usage should rise as old usage falls3.
7. Decommission on evidence
Microsoft lists four conditions for retiring a legacy report15:
- The agreed parallel window has expired.
- Every user of the legacy report can reach the new one.
- Significant activity on the legacy report has stopped.
- No issue has appeared in the new report that could hurt productivity.
Keep the rollback plan until then; earlier file versions serve well15. And budget for the overlap: a parallel run pays both license bills12.
What runs as code, and what needs a person
| Phase | Automated today | Needs a person |
|---|---|---|
| Inventory and scan | Parsing and counting; Tableau Doctor's 25 rules; pbi-doctor's 14, as a prototype | Keep, merge or retire; an owner per report |
| A home for each calculation | Type and target labels from the translator; deep-chain flags | Which filters each number obeys |
| Translation | Draft patterns, PBIP generation, linting | Every LOD, and every line where an empty value matters |
| Parity | SchemaDrift's six checks, with an exit code that can stop a pipeline; CSV input for now | The tolerance, and a reason for every difference |
| Pilot and waves | Nothing of mine yet; the platform's activity log counts usage | Sign-off, training, change management |
| Decommission | Nothing | The decision |
What this means for your BI team
- Sign the tolerance before the first calculation moves. "Close enough," decided afterward, is a negotiation, not a test.
- Ask for the inventory before the quote. Per-report estimates are guesses until a pilot calibrates them.
- Keep the rollback boring. The legacy report stays live until sign-off.
- Budget the parallel run as a real cost. Both licenses run, and so do both refresh schedules.
- Name an owner for every report. A report with no owner stalls at sign-off, then at adoption12.
Notes
- Microsoft Learn, Create content to migrate to Power BI, Stage 4, updated 2026-09-18, accessed 2026-10-17. ↩︎
- Career facts in
creation-test/danieljin-bi/brief/content-inventory.md, section D. They also include a Netezza to Azure Synapse warehouse migration. None was a Tableau and Power BI client migration. ↩︎ - Microsoft Learn, Learn from customer Power BI migrations, updated 2026-01-02, accessed 2026-10-17. ↩︎
tableau/tableau-doctor/README.md: 25 rules, 35 tests. The rule table in../knowledge/modules/tableau-doctor.mdlists CALC01, CALC04, CALC05, CALC07 and DS07 for the risks named here. ↩︎tableau/pbi-doctor/README.md: 14 rules and 51 self-tests; prototype status, with no real project linted yet. ↩︎- Microsoft Learn, Gather requirements to migrate to Power BI, Stage 1, updated 2026-01-02, accessed 2026-10-17. ↩︎
creation-test/danieljin-bi/brief/research-migration.md, section 2f: a calculated column is computed at refresh and ignores every slicer. ↩︎creation-test/danieljin-bi/shared/TRANSLATOR.md: it translates one formula at a time and cannot read the workbook's context filters. ↩︎creation-test/danieljin-bi/brief/content-inventory.md, section B8, PBIP generator. Method only; the project it was built for is not described here. ↩︎tableau/schemadrift/README.md: six checks; a synthetic demo of 5,000 against 4,998 rows fails with 8 findings. It reads CSV only, with no warehouse adapters yet. ↩︎- Kansas City Open Data, re-run on 2026-10-17:
creation-test/danieljin-bi/content/checks/kc311_recheck_2026-10-17/manifest.json. Public data, not a client. Full story in What Kansas City 311 stopped measuring. ↩︎ - Antares, How to migrate Tableau to Power BI, 2026-09-30, accessed 2026-10-17. A vendor page, read as practitioner advice. ↩︎
- Microsoft Learn, Visual calculations overview, ms.date 2026-10-13, accessed 2026-10-17. ↩︎
- Microsoft Learn, Row-level security with Power BI, ms.date 2026-05-13, accessed 2026-10-17. ↩︎
- Microsoft Learn, Deploy to Power BI, Stage 5, updated 2026-02-24, accessed 2026-10-17. ↩︎
Sources
Weighing a move between Tableau and Power BI?
Email Daniel