Tableau to Power BI, and back: the translation table
Most Tableau calculations cross to Power BI in one line, and the ones that quietly change a number cross just as easily.
Most Tableau calculations cross to Power BI in one line. So do the ones that change your numbers.
They compile. They render. Nothing on screen says the number moved. This is the table I work from: the trap, the safer pattern, and the page that documents it.
Start with one question
Which filters should this number obey?
Tableau answers with a fixed order. Extract and data source filters run first, then context filters, then FIXED expressions, then ordinary dimension filters1. INCLUDE and EXCLUDE run after those; table calculations run last2.
Power BI has no context-filter step. Slicers, page filters and visual filters join one filter context, and each measure keeps or removes them inside CALCULATE3. In Tableau, the sheet's context filters hold the answer. In Power BI, you write it into every measure.
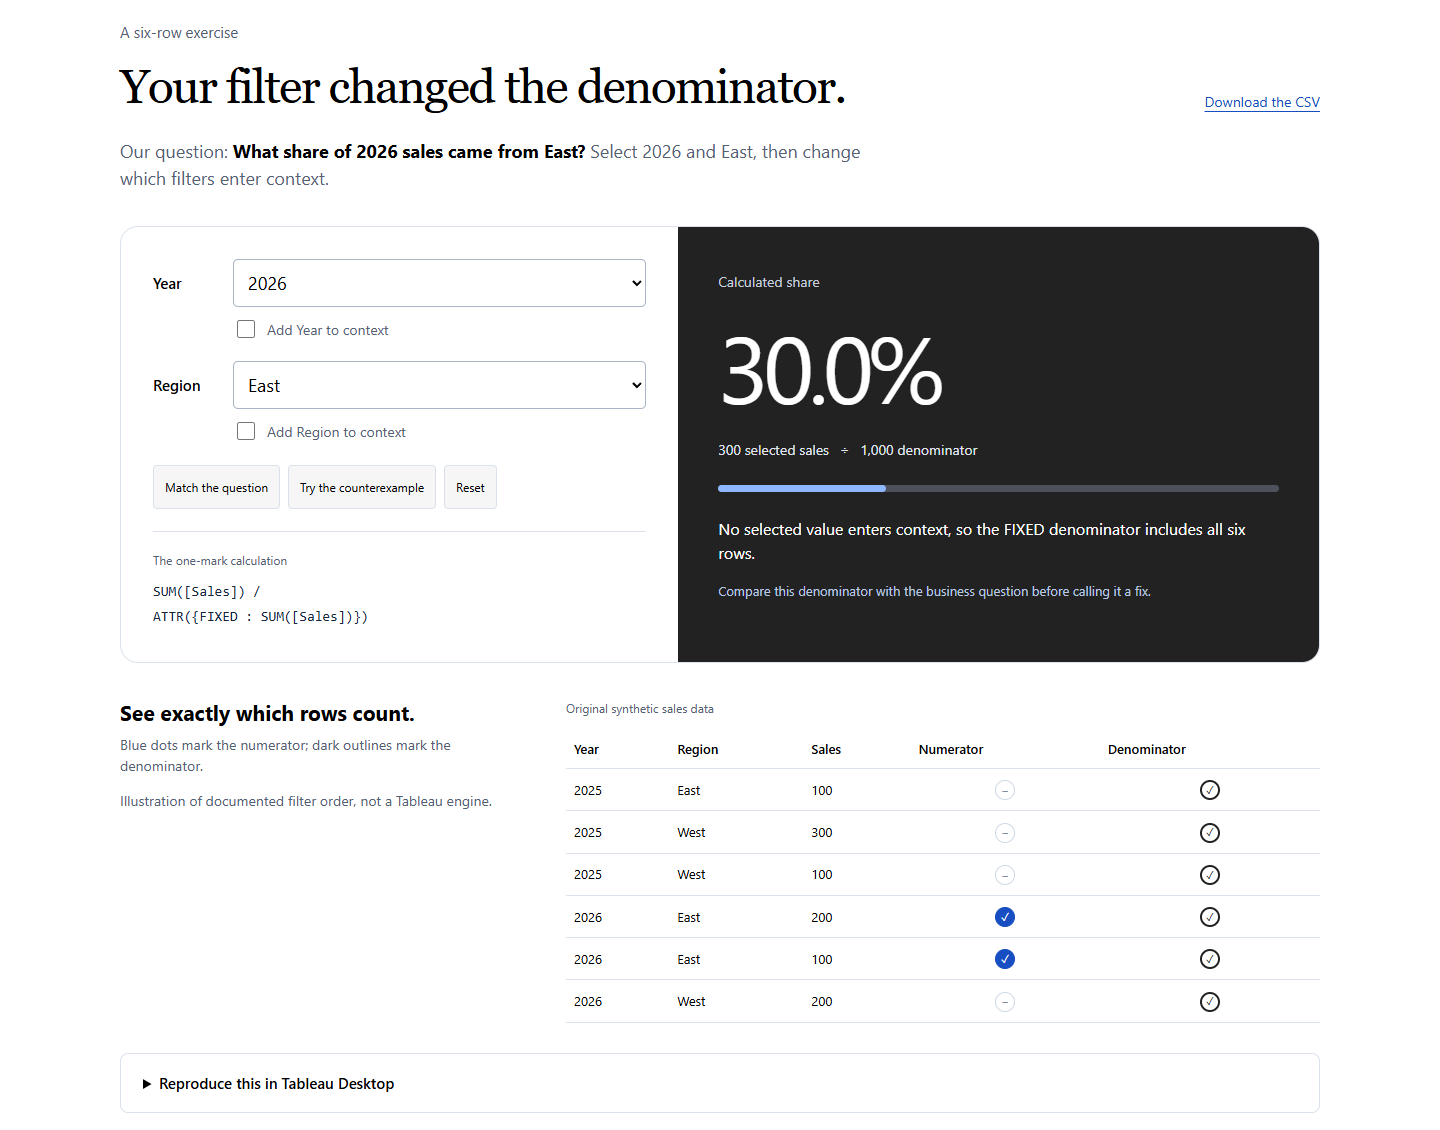
By Tableau's documented order, the same formula returns 30%, 60%, 75% or 100% for the same selections. The filter lab walks all four.
Level of detail: where drift starts
| Tableau | Power BI pattern | The trap |
|---|---|---|
{ FIXED [Customer] : SUM([Sales]) } | CALCULATE([Sales], REMOVEFILTERS(), VALUES(Customer[Customer])) | FIXED ignores dimension filters but obeys context filters. Add those back with VALUES25. Exact at Customer grain; test coarser grains. Derived. |
| The same FIXED, as many guides write it | CALCULATE([Sales], ALLEXCEPT(Sales, Sales[Customer])) | When Customer carries no filter, it returns the grand total5. |
AVG({ INCLUDE [Customer] : SUM([Sales]) }) | AVERAGEX(VALUES(Customer[Customer]), [Sales]) | INCLUDE runs after dimension filters, so slicers apply on both sides2. Derived. |
{ EXCLUDE [Region] : SUM([Sales]) } | CALCULATE([Sales], ALLSELECTED(Geo[Region])) | EXCLUDE still obeys a Region filter. REMOVEFILTERS(Geo[Region]) drops that slicer too23. Derived. |
The ALLEXCEPT version appears in published guides from 2018 to 20266. SQLBI's worked example shows its cost. France's share of continent sales reads 11.48% while Continent is on the report. Remove Continent, and the same measure says 3.32%, a share of the world5.
Nulls and blanks
Tableau's NULL spreads. DAX's BLANK hides.
| Expression | Tableau | DAX |
|---|---|---|
[a] + [b], one side empty | NULL | The other value: BLANK() + 4 is 47 |
x / 0 | NULL | Infinity with /; DIVIDE returns BLANK7 |
[Cost] = 0, cost empty | NULL | TRUE, because BLANK equals 0 in comparisons7 |
IIF(test, a, b), test empty | The optional "unknown" argument, else NULL | b, because BLANK counts as FALSE8 |
COUNTD(x) with empties | Skips them | DISTINCTCOUNT counts BLANK as a value; use DISTINCTCOUNTNOBLANK9 |
Picture a row-level margin with one cost missing. Tableau returns NULL for that row and leaves it out. DAX reads the missing cost as zero and books the revenue as pure margin. That example follows from the rows above; I have not run it in both engines.
Same name, different answer
Shared names are the worst traps. They promise a match they do not keep.
| Function | Tableau | DAX | Safer choice |
|---|---|---|---|
INT(-9.7) | -9, toward zero | -10, rounds down | TRUNC10 |
FIND | 0 when absent | Arguments flip; an error when absent | Set NotFoundValue10 |
TRIM | Strips the ends | Also collapses inner spaces | Test text keys first10 |
REPLACE | Swaps a substring | Replaces by position | SUBSTITUTE, which is case-sensitive10 |
DATEADD | Returns a date | Returns a table of dates | EDATE, then test month ends10 |
| Week start | Data source, else locale | WEEKNUM starts on Sunday | ISO weeks on both sides10 |
RANK | Descending by default | ORDERBY ascending by default | Write DESC11 |
FIRST(), INDEX() | An offset; a row's position | A row's value; a row, as a table | Translate the logic, not the name11 |
Objects, not only formulas
- Dashboards. A Tableau dashboard becomes a Power BI report page. A Power BI dashboard is a different object: pinned tiles in the service12.
- Row-level security. Power BI RLS binds only the Viewer role. Workspace Admins, Members and Contributors see every row13.
- Blends. Tableau blends aggregate each source, then combine. Power BI relationships filter rows first, so a many-to-many blend can total differently12.
- Table calculations. Visual calculations reached general availability in May 2026, the closest twin yet14. They cannot be filtered or refer to themselves, and data exports leave them out.
The trip back
Power BI to Tableau is the quieter direction. My October 2026 searches found no converter that goes this way, so plan a rebuild15.
| Power BI | Tableau | Note |
|---|---|---|
DIVIDE(a, b) | a / b | Tableau already returns NULL on zero7. |
CALCULATE([m], ALLSELECTED(col)) | { EXCLUDE col : ... } or TOTAL() | Both keep outer filters211. Derived. |
CALCULATE([m], REMOVEFILTERS(Dim)) | { FIXED ... } | Put the filters it must obey in context2. Derived. |
TOTALYTD, SAMEPERIODLASTYEAR | RUNNING_SUM restarting by year; LOOKUP(expr, -n) | The dates must be in the view11. Derived. |
| Field parameters, calculation groups | A parameter plus CASE | No direct twin found16. |
RLS with USERPRINCIPALNAME() | USERNAME() or ISMEMBEROF() with an entitlement table | Test as real users1713. |
What converters claim
One converter's page puts its accuracy at 75% to 90% in one place and 70% to 90% in another18. Another claims 99% accuracy, while its own FAQ says 30% to 40% of the effort may remain18. Neither publishes a method.
No tool decides whether a FIXED should obey a slicer. No tool decides how a many-to-many blend should total. Those are business rules, and each one needs an owner.
Try it on the home page
The translator on the home page turns this table into code. Paste { FIXED [Customer Name] : SUM([Sales]) }, and it returns the REMOVEFILTERS pattern, graded review, with the reason. Paste INT([Discount]), and it returns TRUNC, graded equivalent.
Every answer carries one of four grades: exact, equivalent, review or unsupported19. All 605 of its automated checks pass. None of its output has yet run inside Power BI Desktop or Tableau.
It reads one formula, not the workbook. It cannot see your context filters, so its notes say where to look. Review means one thing: run a parity test.
How sure each row is
Unmarked rows rest on Tableau, Microsoft or SQLBI documentation, read on 17 October 2026; the blends note also leans on a vendor guide. Rows marked Derived follow from those rules but have not run in both engines. Treat them as tests to run, not answers to paste.
What this means for your BI team
- Ask which filters each number obeys. Get every sheet's context-filter list before a FIXED expression moves.
- Put an empty value in every test. Each ratio KPI needs a zero and a blank in its test data.
- Flag
ALLEXCEPTin code review. RequireREMOVEFILTERSplusVALUES, or a written reason. - Ask a converter vendor for its row list. Whatever the tool skips is your budget.
- Agree which visuals may change. One Microsoft customer found that not every report could be replicated, so it told authors to build fit-for-purpose reports, not replicas20.
Notes
- Tableau Help, Tableau's Order of Operations, accessed 2026-10-17. Both orders side by side:
creation-test/danieljin-bi/brief/research-migration.md, section 2h. ↩︎ - Tableau Help, Level of Detail Expressions and Filters, accessed 2026-10-17. FIXED is computed before dimension filters; INCLUDE and EXCLUDE after them. ↩︎
- Microsoft Learn, ALLSELECTED and REMOVEFILTERS, accessed 2026-10-17. The Power BI order and the EXCLUDE pattern are derived from them: research-migration.md, sections 2f and 2h. ↩︎
- Six invented rows from
tableau/doctor/studio/episode-001.md. The lab illustrates Tableau's documented filter order in JavaScript; confirmation in Tableau Desktop is still pending. ↩︎ - Marco Russo and Alberto Ferrari, SQLBI, Using ALLEXCEPT versus ALL and VALUES, updated 2021-08-27, accessed 2026-10-17. ↩︎
- DataVeld, 2018-02-17, and Beyond the Analytics, 2026-04-11, both accessed 2026-10-17. Both map FIXED to ALLEXCEPT; the 2026 guide also maps EXCLUDE to REMOVEFILTERS. ↩︎
- Salesforce Help, Calculated Field Returns Null Results; SQLBI, Handling BLANK in DAX; dax.guide, division; Microsoft Learn, DIVIDE. All accessed 2026-10-17. ↩︎
- Tableau Help, Logical functions, and SQLBI, Handling BLANK in DAX. Accessed 2026-10-17. ↩︎
- Tableau Help, Aggregate functions; Microsoft Learn, DISTINCTCOUNT. Accessed 2026-10-17. ↩︎
- Tableau Help, type conversion, string and date functions. Microsoft Learn, INT, FIND, TRIM, REPLACE, DATEADD and WEEKNUM. All accessed 2026-10-17; full list in research-migration.md, sections 2c to 2e. ↩︎
- Tableau Help, Table calculation functions; Microsoft Learn, RANK and FIRST. Accessed 2026-10-17. ↩︎
- Tableau Help, Blend your data; Microsoft Learn, Dashboards; and Antares, a vendor guide read as practitioner advice. Accessed 2026-10-17. ↩︎
- Microsoft Learn, Row-level security with Power BI, ms.date 2026-05-13, accessed 2026-10-17. ↩︎
- Power BI May 2026 Feature Summary; Microsoft Learn, Visual calculations overview, ms.date 2026-10-13. Accessed 2026-10-17. ↩︎
- Searches on 2026-10-17 found no Power BI to Tableau converter, and no Microsoft-built Tableau converter. Absence is unverified. Reverse-trip rows: research-migration.md, section 2i. ↩︎
- Tableau Help, Create parameters; Microsoft Learn, Field parameters, ms.date 2026-06-09. Accessed 2026-10-17. No Tableau twin for calculation groups was found. ↩︎
- Tableau Help, Row-level security options and User filters, accessed 2026-10-17. ↩︎
- Vendor claims, unverified: Pulse Convert and Sparity BIPort, page dated 2024-09-17. Both read on 2026-10-17. ↩︎
creation-test/danieljin-bi/shared/TRANSLATOR.md: grades, coverage and known limits.node test_translator.mjspassed 605 of 605 checks under Node 24.19.0 on 2026-10-17. ↩︎- Microsoft Learn, Learn from customer Power BI migrations, updated 2026-01-02, accessed 2026-10-17. ↩︎
Sources
Weighing a move between Tableau and Power BI?
Email Daniel